
Understanding the present
The Asia Pacific region is a market of more than 2 Billion people and there are many countries within the region. The size and differences means that agencies do not have an easy time targeting and creating ads for this region. Therefore agencies typically deal with the fragmented region by having local offices in each country with some countries as the headquarters for certain regions. Different creatives and media strategy have to be crafted for different markets.
The AP region is of great interest to mobile advertisers because of the fast rising affluence of consumers and how widespread mobile devices are helping to bring the masses online. However agencies have to deal with the reality of fragmentation in the Asian market due to economic, technological and cultural differences. The countries are so different in nature that the same media strategy and creative execution will rarely work cross markets. Thus this article looks into how marketeers can understand and recognize mobile device penetration in AP countries and modify their mobile media and creation campaign strategy.
There is a easy way to segment the current OS penetration in the Asia region which can be divided into two main segments of the “Haves” and “Have Nots”.
In the “Have” segment, countries have high smartphone penetration and good 3G access networks. In the “Have Nots” regions, the countries have low smartphone penetration with low 3G access and the data typically looks like that of a “Have” country from 3 years ago before 3G data plans became affordable and smartphones with good internet browsers came onto the market.
Mobile OS market share derived browsing data
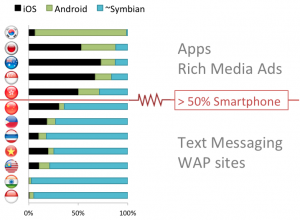
One can approximate smartphone penetration by the extent of economic development in country. This chart shows what mobile OSes are used to access the internet and it clearly shows the distinction between the countries that use smartphones and the countries that do not.
Currently in AP, there are 3 main OSes and they are
- iOS in light blue,
- Android in dark blue and
- Symbian and others in Green.
Because mobile marketing is highly dependent on how consumers use their phones and what technology is available on their phone, understanding this chart will help you shape the media and creative that you will recommend to the client.
In the “Have” countries a brand can make apps and expect good downloads and reception. These are usually iOS and Android apps given the high penetration of these 2 mobile OS among the smartphone segment. Games and sponsored utilities apps are the most popular choices for apps as advertising/marketing vehicles. Good mobile browsers and In-app advertising also means that you can buy display advertising in volume with the expectation that your ads will reach most of the population and at high enough frequency. A brand can also take advantage of the latest rich media ad formats that are generally supported by smartphones which means that branding campaigns can be executed on mobile devices.
In the “Have Not” countries, mobile marketing is more limited in media and creative. They are usually simple text messaging and WAP sites. Because of the difficulty in supporting WAP site creation among the fragmentation of feature phones and inferior browser technology , site creation is more complicated. This means most mobile advertising is text messaging. Reach and cost is also an issue as SMS campaigns are much more expensive to implement than mobile display advertising. Therefore SMS is usually used as a activation medium to elicit direct response from consumers compared to being a branding channel. Some brands might even decide that mobile does not meet their objectives and therefore allocate the budget to TV where the reach and frequency is the highest as most consumers’ time is spent watching TV content.
Projecting the future
Mobile has made a phase change with the introduction of smartphones around end 2008 in the AP region. Looking at Singapore’s data from 3 years ago, we can try to project what is the most likely outcome in the next 12-18 months in the “Have Nots” countries.
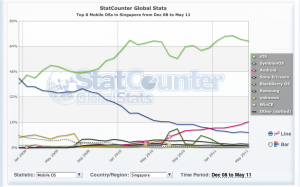
Singapore’s Mobile OS share of web page impression after the iPhone was released for about 6 months in Dec 2008.
After the launch of iPhone, we can immediately see Symbian’s share being eroded as iOS quickly rides to the top. The iPhone made it much more user friendly to browse the web and use apps. It led to a huge increase in the iPhone browsing traffic. For 18 months, there wasn’t much competition for the iPhone as it took more market share. Around mid 2010, operators started to push Android devices to consumers as the iPhone Alternative. The Galaxy S, launched as the spearhead of Android Phones, quickly became popularly with consumers.From then Android takes a huge leap and into its current second place position. As it stands, iOS and Android commands more than 50% of mobile traffic in Singapore.
The historical data has shown that it takes 18 months from the introduction of smartphones for a country to transition from a “Have Not” to a “Have” country. Thus the question is then given that smarpthone prices are constantly dropping and data networks are becoming more affordable in the “Have not’ countries, will the country make the leap into “Have” group in the next 18 months?
One can make a prediction by looking at smartphone adoption rate over the past year as Android devices make their way into the “Have Not” countries. In the case of Singapore, Smartphones marketshare increased from 0% to 15% in 6 months ad iOS overtook Symbian’s marketshare 6 months after launch. We will use these 2 indicators as guidelines for our projection.
Predictons

Linear projection showing which mobile smartphone OS will likely be the dominant OS in the country in the next 18 months.
Prediction of which countries will have more than 50% smartphone penetration in the next 18 months
From the guidelines above, one can predict that China(iOS), Philippines(Android), Vietnam(iOS) & Malaysia(Android) will cross over to the “Have” group soon. However two out of the three largest markets in AP (India and Indonesia) have shown small smartphone growth and are predicted to have little smartphone growth due to backward data networks and the lack of purchasing power among the masses.
Conclusion and recommendations
This article has laid out the current mobile landscape around us. Asia is a complicated place but the overall trends are that
- Leading Mobile OSes are Symbian, iPhone and Android = Apps and websites should be built for these platforms
- iPhone & Android are the handsets of the future = Marketers should be run experimental campaigns in the Have countries which can be extended the the general AP region when the “Have Not” countries move into the “Have” group.
- Large markets like India and Indonesia are unlikely to be smartphone friendly = Feature phone marketing skills is still necessary
- Apps and Rich Media Ads work well in Have regions, text messaging pretty much the only medium of mobile marketing in Have Not regions.